| Execution Times (seconds) | ||||||||
|---|---|---|---|---|---|---|---|---|
| DBpedia 3.6 | DBpedia 3.7 | DBpedia 3.8 | DBpedia 3.9 | DBpedia 2014 | DBpedia 2015-10 | DBpedia 2016-10 | ||
| DBpedia 3.6 | 102.443 | 117.010 | 170.439 | 180.098 | 277.487 | 272.551 | ||
| DBpedia 3.7 | 84.796 | 87.725 | 131.463 | 171.871 | 214.211 | 211.441 | ||
| DBpedia 3.8 | 70.712 | 70.870 | 98.002 | 124.336 | 175.739 | 182.236 | ||
| DBpedia 3.9 | 70.642 | 77.645 | 69.110 | 119.715 | 164.336 | 180.310 | ||
| DBpedia 2014 | 64.707 | 76.045 | 80.116 | 114.240 | 156.982 | 169.473 | ||
| DBpedia 2015-10 | 72.486 | 85.573 | 95.254 | 118.817 | 138.493 | 193.315 | ||
| DBpedia 2016-10 | 68.585 | 79.547 | 83.774 | 136.107 | 127.810 | 157.255 | ||
Here, we can find the details of each dataset:
| Dataset Details | |||||
|---|---|---|---|---|---|
| NonSingletonCodes | Alphabet Size | #Transactions | #Items | Average Row | |
| DBpedia 3.6 | 1,554 | 16,466 | 2,476,538 | 40,567,138 | 16.38 |
| DBpedia 3.7 | 1,199 | 26,810 | 2,899,989 | 64,303,680 | 22.17 |
| DBpedia 3.8 | 859 | 29,416 | 3,581,783 | 83,231,510 | 23.24 |
| DBpedia 3.9 | 851 | 37,136 | 4,685,189 | 114,064,977 | 24.35 |
| DBpedia 2014 | 637 | 45,162 | 5,063,500 | 159,266,389 | 31.45 |
| DBpedia 2015-10 | 907 | 61,580 | 5,948,202 | 206,837,396 | 34.77 |
| DBpedia 2016-10 | 741 | 61,198 | 6,601,796 | 209,169,342 | 31.68 |
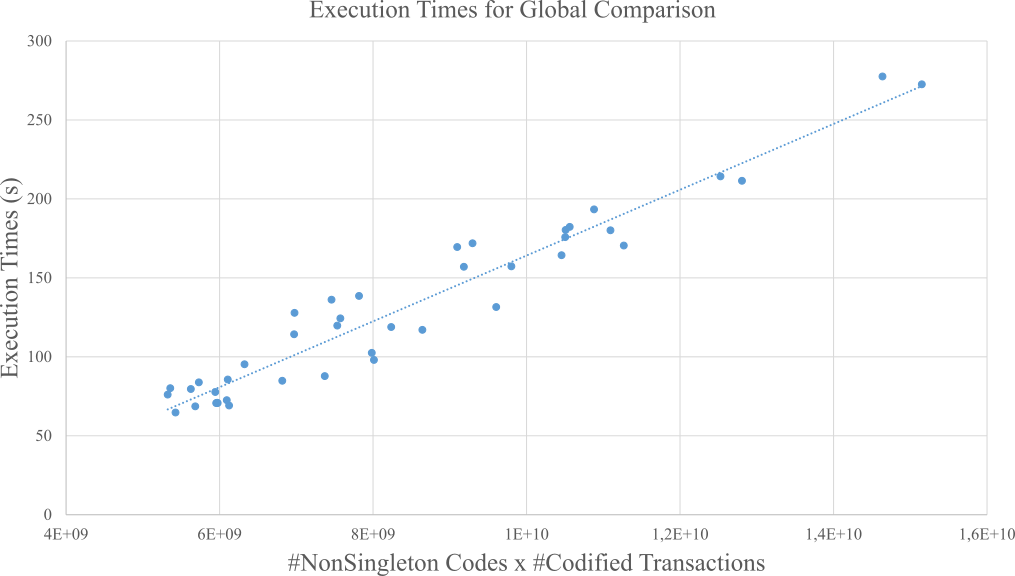
In order to show a tendency, we have to analyze the cost of the algorithms used to calculate the similarity. Without entering the details, the main components of the cost of codification of a database are the number of nonSingleton codes that we have to check for each transaction, and the number of transactions (the actual size of the transaction should be also in the equation, but is usually much smaller than the other two terms, so for the tendency we consider it to be a constant). Naively, each measure implies the codification of the database twice, once with each code table, so to show the tendency of the algorithm, the following graph show the execution times against the sum of nonSingleton codes in both code tables times the number of transactions. We can see how the execution times follow a linear tendency on this variable (/NonSingletonCodes/*/#Transactions/), which makes our approach really scalable.